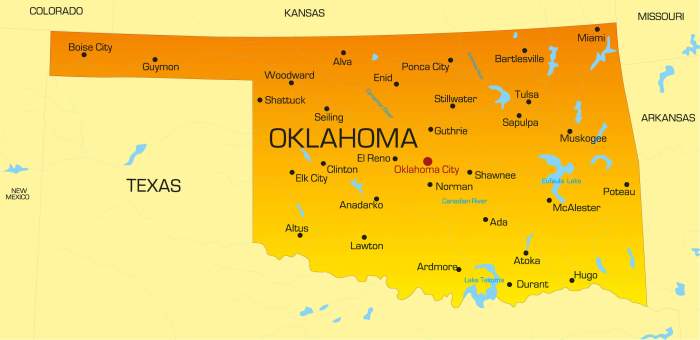
| Map Type | Characteristics | Applications | Examples |
|---|---|---|---|
| Physical Maps | Depict natural features such as mountains, rivers, and vegetation | Geography, geology, environmental studies | World Physical Map, Topographic Maps |
| Political Maps | Show political boundaries, countries, and major cities | Political science, history, international relations | World Political Map, US Electoral Map |
| Thematic Maps | Focus on specific themes or data, such as population density or economic activity | Social sciences, economics, epidemiology | World Population Density Map, US Income Distribution Map |
| Topographic Maps | Provide detailed elevation information through contour lines | Navigation, land use planning, engineering | USGS Topographic Maps, Ordnance Survey Maps |
Map Elements and Their Significance

Maps are powerful tools for visualizing and understanding geographic information. To convey this information accurately and effectively, maps rely on several essential elements, including scale, legend, symbols, and projections. Each of these elements plays a crucial role in ensuring that maps communicate geographic data clearly and comprehensively.
Scale
Scale refers to the relationship between the distance on a map and the corresponding distance on the ground. It is essential for understanding the spatial extent of features represented on the map. Maps can use different scales, such as large-scale maps that show detailed information over a small area or small-scale maps that provide a broader overview of a larger area.
Legend
A legend is a key that explains the symbols and colors used on the map. It helps users interpret the map by providing information about what each symbol or color represents. Legends are particularly important for thematic maps that use different symbols or colors to represent different types of data, such as land use, population density, or vegetation cover.


